
Economic indicators: Why do they matter for traders?
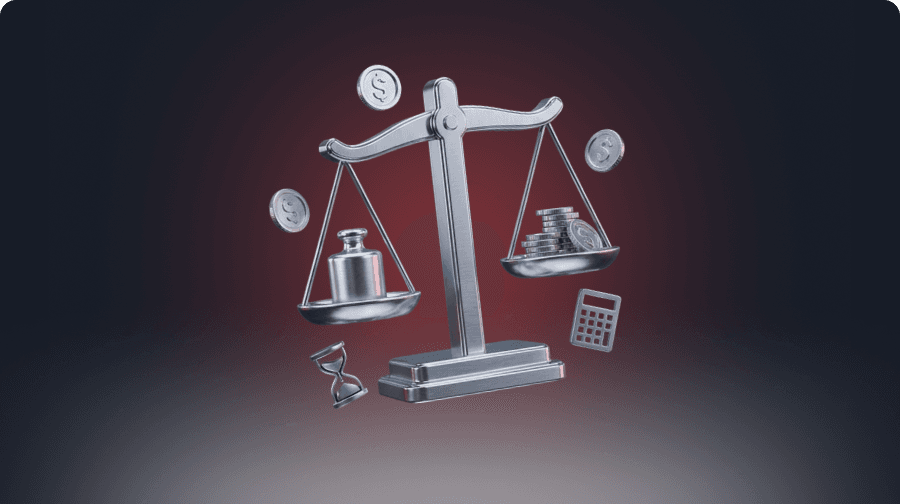
Economic indicators are essential tools that provide valuable insights into the state of an economy.
Economic indicators are essential tools that provide valuable insights into the state of an economy. These metrics guide investors, policymakers, and even voters in understanding economic trends and making informed decisions.
Economic indicators play a critical role in shaping the value of major American assets, including NASDAQ and the S&P 500.
There are several different types of economic indicators: leading, lagging, and coincident.
Economic indicators can impact U.S. politics, particularly during presidential elections.
Economic indicators: Definition
Economic indicators are critical statistical measures used to analyze the health and direction of an economy. These indicators provide insight into economic activities such as GDP, employment, and inflation, and can significantly influence financial markets. By analyzing these metrics, investors, policymakers, and economists can make informed decisions about upcoming economic trends.
The impact of economic indicators on major American indices, such as the NASDAQ and the S&P 500, is undeniable. Positive indicators often boost investor confidence, leading to higher stock prices. Conversely, negative indicators can lead to substantial market sell-offs. They can also impact monetary policy decisions, affecting the U.S. Dollar value and, as a result, the stock market. Understanding these indicators is crucial for navigating the financial market and making insightful investment decisions.
What are economic indicators?
Economic indicators are vital tools for assessing a country's overall economic health. They are typically categorized into three main types: leading, lagging, and coincident (we discussed them below; go and find out).
Examples of economic indicators include the unemployment rate (a lagging indicator), inflation (a coincident indicator), and interest rates (a leading indicator). These metrics help economists, policymakers, and investors make informed decisions by providing a clear picture of economic trends.
Metals and commodities as economic indicators
While metals and commodities are not traditional economic indicators, their price movements can offer valuable insights into the state of the economy. For example, gold (XAUUSD) is often seen as a hedge against inflation; rising gold prices can signal increasing inflation concerns. Copper is also known as “Dr. Copper” because of its correlation with economic activity. When copper prices rise, it typically indicates robust economic health.
Similarly, oil prices significantly affect inflation by influencing transportation and production costs across industries. Therefore, monitoring commodities can provide crucial information about economic trends.
NFP
The Non-Farm Payroll (NFP) report is a crucial economic indicator that reflects the number of jobs added or lost in the U.S. economy, excluding the farming sector. Released monthly, the NFP is closely watched because it directly correlates with the unemployment rate. The NFP is a crucial metric for policymakers and investors, influencing decisions on interest rates and market movements.
Types of economic indicators
Economic indicators are classified into three main types: leading, lagging, and coincident indicators. Each type provides unique insights into different aspects of the economy.
Leading
Leading economic indicators are metrics that tend to predict future economic activity, offering a glimpse into where the economy might be headed. These indicators include stock market performance, new business orders, and consumer sentiment. In the U.S., leading economic indicators often reflect shifts in the USD's history.
For instance, a rise in durable goods new orders indicates upcoming economic expansion, while a decline suggests a slowdown. These are crucial for investors and policymakers as they provide early signals of economic turning points.
Lagging
Lagging economic indicators are metrics that confirm patterns and trends after they have occurred. They provide insight into the economy’s past performance and help validate whether predictions based on leading indicators were correct. Common lagging indicators include inflation and corporate profits. These indicators are essential for understanding USD performance and how significant indices like the DJIA and Russell 2000 have reacted to economic changes. For example, an increase in corporate profits might confirm that the economy has grown, even if the initial signals appeared months earlier.
Coincident
Coincident economic indicators move in step with the overall economy, reflecting current economic activity. Examples include American GDP, employment levels, and retail sales. These indicators are valuable because they provide a real-time snapshot of the economy's health, allowing analysts to assess its performance at any given moment.
Economic indicators in politics
Economic indicators play a crucial role in shaping political landscapes, especially in U.S. elections. Politicians and policymakers closely monitor these indicators, which can significantly influence voter sentiment. During election campaigns, candidates often highlight positive economic trends to increase their chances or criticize negative indicators to challenge their opponents.
In U.S. presidential elections, economic performance is often a decisive factor. Voters tend to favor candidates with strong economic indicators, associating them with effective leadership. Conversely, poor results can lead to political challenges and power shifts. Institutions like the FED and IMF also rely on these indicators to make policy decisions that can affect both national and international politics.
Conclusion
Understanding economic indicators is crucial for anyone involved in finance, business, or politics. These metrics not only identify and confirm economic trends but also play a pivotal role in shaping political outcomes, particularly in the U.S. elections. By staying updated about leading, lagging, and coincident indicators, traders can better navigate their investments and make more informed decisions.
Tags:
Macro Basics
Related articles

Macro Basics Federal Open Market Committee (FOMC): Introduction
Investors closely follow the decisions of the Federal Open Market Committee (FOMC), the policymaking body of the Federal Reserve System.

Macro Basics Trading times: Worldwide market
In the bustling world of finance, understanding trading times is crucial for investors aiming to navigate the global marketplace effectively.

Macro Basics Non-Farm Payrolls: NFP explained
Exploring the fundamentals of Non-Farm Payrolls (NFP), a crucial economic indicator that significantly impacts global financial markets by reflecting employment...
Macro Basics Understanding jobless claims
Jobless claims are a crucial economic indicator that tracks the number of people filing for unemployment benefits after losing their jobs.
Macro Basics What is a Producer Price Index?
The Producer Price Index (PPI) is a key economic indicator that tracks the average changes in selling prices received by domestic producers for their output over time.

Macro Basics Understanding personal income and outlays
Personal income and outlays are critical aspects of national economic performance. They encompass individuals’ earnings from wages, investments, and other sources, as...

Macro Basics U.S. GDP: A key indicator
Gross Domestic Product (GDP) is a key indicator of an economy’s performance. In the U.S., it reflects the total market value of goods and services produced...

Macro Basics Inflation rate: Understanding its impact on the economy
Inflation is a key economic indicator that measures the rate at which the general level of prices for goods and services rises, eroding purchasing power.